
By Bernice Silvas
For something that affects our daily lives, routines, and plans, like forcing us to stay indoors when it’s pouring heavily or to put on sunscreen when the temperatures soar, steady deviations from normal weather patterns fly under the radar. Syracuse and other parts of CNY, however, have not. The area is reported to have become hotter in the last few years, which has led to less chilly winters. But what are these changes exactly? Why are they important? And what’s causing them?
The Changes and Their Importance
As said before, Syracuse summers have been reported to be getting hotter steadily. Seeing it in a picture better demonstrates this shift. Down below is a graph showing Syracuse’s average monthly temperature over 2020 through 2025, with each dot representing a month’s mean temperature. From September 2023 and onward, the average temperature has been climbing to 51.6°F, which doesn’t seem like much compared to the previous months fluctuating around an average of 50.2°F.
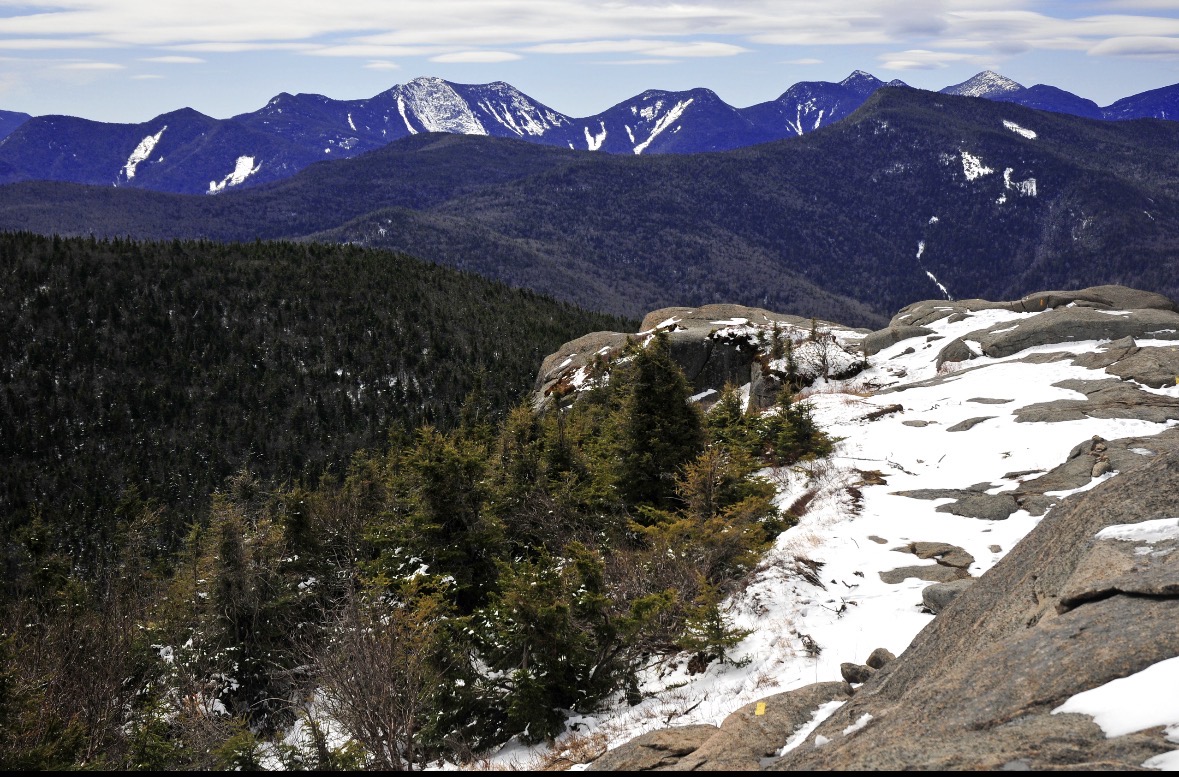
Despite this small difference, the impact is real and growing. Higher temperatures mean shorter winters, which leaves places like the Adirondacks and Catskills reeling from threats to winter recreation facilities like ski resorts, snowmobiling, and ice-fishing. Outdoor tourism, like hiking the mountains, is also heavily affected, due to it accounting for 19% of the area’s employment. Along with this, farmers now have to account for later and earlier frosts, droughts, and other issues that may occur, like delayed plantings. Two other issues are invasive species advancing from where cold weather kept them and habitat and native species loss from said advancement, which, in turn, leads to an decrease in the biodiversity of those regions.
The Causes
When people are asked the reasons for rising temperatures, they usually mention something about CO₂ emissions. CO₂ is a gas that prevents Earth’s heat from naturally radiating into space and too much of it keeps too much heat in, leading to all the problems that climate change brings. This is why Syracuse has been reducing its emissions such as installing LED streetlights and traffic signals, optimizing waste collection routes by updating old routes, and expanding the Urban Forestry by updating its policies and partnering with programs like the Onondaga Earth Corps and and SUNY ESF for projects like Syracuse Urban Food Forest Project. These programs and changes have led to emission reductions of 67% as of the 2024 GHGI (Greenhouse Gas Emission Inventory) report. Even with this improvement, temperatures still seem to be increasing. The National Oceanic and Atmospheric Administration (NOAA) scientists believe that this is in part with the world’s oceans heating up and a phenomenon called El Niño, a warming of the ocean surface that results in ocean surface winds. For New York, this pattern causes heightened temperatures along with more precipitation. This pattern along with rising ocean temperatures have bolstered effects of CO₂ emissions and have been projected to continue unless emissions are cut down further.
Works Cited
jon@eliteventure.media. “Extreme Weather Impacts Agriculture – New York Animal Agriculture Coalition.” New York Animal Agriculture Coalition, 3 Aug. 2023, nyanimalag.org/extreme-weather-impacts-agriculture/. Accessed 16 June 2026.
National Oceanic and Atmospheric Administration . “The World Just Sweltered through Its Hottest August on Record | National Oceanic and Atmospheric Administration.” Www.noaa.gov, 14 Sept. 2023, www.noaa.gov/news/world-just-sweltered-through-its-hottest-august-on-record. Accessed 16 June 2026.
NCEI.Monitoring.Info@noaa.gov. “Climate at a Glance | National Centers for Environmental Information (NCEI).” Noaa.gov, 2026, www.ncei.noaa.gov/access/monitoring/climate-at-a-glance/city/time-series/USW00014771/tavg/60/0/2020-2025?base_prd=true&begbaseyear=1981&endbaseyear=2010. Accessed 16 June 2026.
New York State Climate Impacts Assessment. “Climate Impact Spotlight: The Adirondacks Region.” New York State Climate Impacts Assessment, 18 Jan. 2024, nysclimateimpacts.org/explore-by-region/the-adirondack-region/. Accessed 16 June 2026.
—. “Temperature.” New York State Climate Impacts Assessment, 22 Dec. 2023, nysclimateimpacts.org/explore-the-assessment/new-york-states-changing-climate/nysc-temperature/. Accessed 16 June 2026.
Onondaga County . “Climate and Health – Health.” Health, 30 Mar. 2026, onondaga.gov/health/climate-and-health/. Accessed 16 June 2026.
Ritz-Kenny, Mac. “Effects of Climate Change on the Adirondacks.” UCAN United Climate Action Network, 29 Mar. 2021, unitedclimateaction.org/effects-of-climate-change-on-the-adirondacks/. Accessed 16 June 2026.
USGS. “What Is “El Niño” and What Are Its Effects? | U.S. Geological Survey.” Www.usgs.gov, 26 July 2024, www.usgs.gov/faqs/what-el-nino-and-what-are-its-effects. Accessed 16 June 2026.
www.syr.gov. “Mayor Walsh Announces Release of Greenhouse Gas Emissions Inventory.” Syr.gov, 24 Apr. 2025, www.syr.gov/News/City-News/City-2025/2025-07-24-Mayors-Office-News. Accessed 16 June 2026.